Debugging Methods
The debugger allows you to watch the program flow while examining the values of variables evaluated in the process. However the 'C' code that is executed and debugged is different from the Verilog-A code that you developed. This section explains the structure of the 'C' code and how it relates to the Verilog-A code and provides guidance on how to go about a debugging session.
In this topic:
Execution Flow
The compiled Verilog-A code defines how the device equations are evaluated while iterating to a solution. For every time step, the lf_load function will execute at least twice (for a linear system) but it is more usual to execute around 4 to 8 times up to a maximum of 40 (controlled by ITL7 option setting).
Once a time step has converged, the time will advance and a new time step will be started. Sometimes the time step is rejected (even if it converged) and the time is reduced and the process repeats.
You can see the current time step as follows:
- You should see a tabbed window at the bottom labelled Watch 1. Select this to bring into view. If not select menu
- In the watch window enter\\ funcargs->time \\ under the name column. You should see the current time show in the value column
| Instance name | funcargs->debug.instName |
| Model name | funcargs->debug.modelName |
| Time step (i.e. the time difference between timepoints) | funcargs->debug.delta |
C vs Verilog-A
Let's look at the 'C' code and its corresponding Verilog-A code. Note that the line numbers for the Verilog-A code are reported in the 'C' code using the tpl_line macro so we can compare line-by-line.
 |
'C' Code |
The Verilog-A code that created the above is:
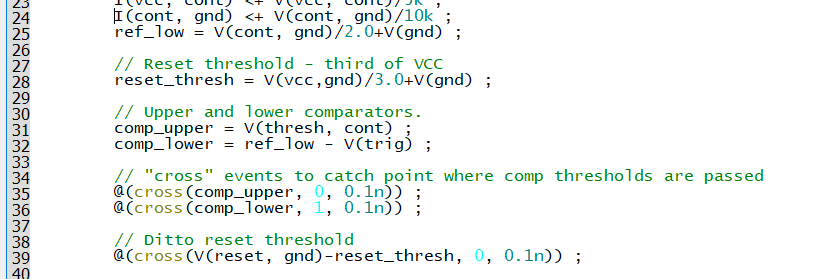 |
Verilog-A code |
Let's look at some of the 'C' lines and corresponding Verilog-A lines.
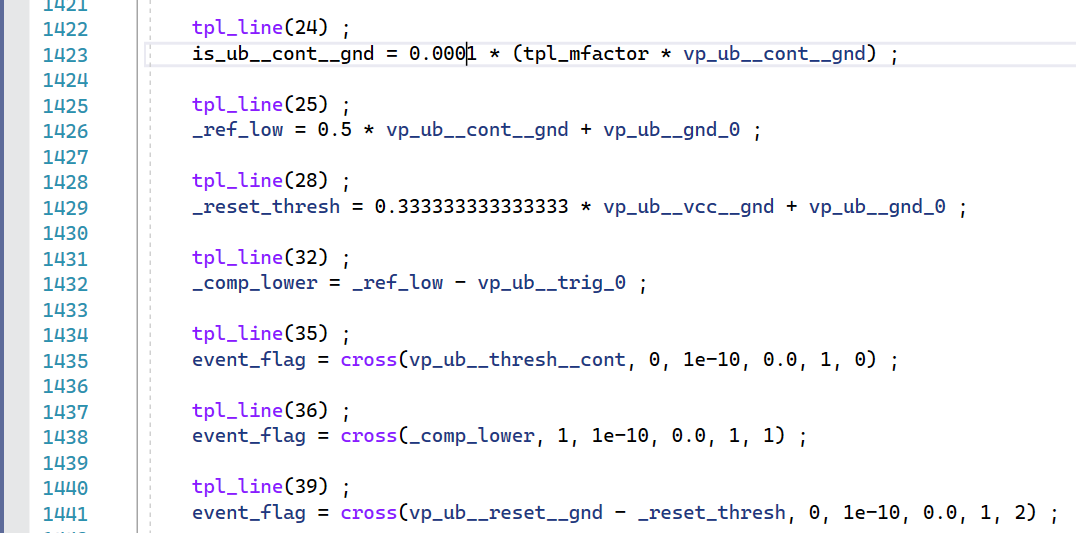
Line 25
ref_low = V(cont, gnd)/2.0+V(gnd) ;
This translates to 'C' as:
_ref_low = 0.5 * vp_ub__cont__gnd + vp_ub__gnd_0 ;
You will notice the following:
- The Verilog-A variable ref_low is the same except for a '_' prefix. In general all user variables are prefixed with an underscore.
- The probe V(cont, gnd) is represented by the 'C' variable vp_ub__cont__gnd. This is made up from: vp : voltage probe\\ ub : unnamed branch\\ _cont : the Verilog-A cont terminal\\ _gnd : the Verilog-A gnd terminal Each component is joined by an underscore. The probe V(gnd) is treated in a similar way.
- The /2.0 is replace *0.5. In general the Verilog-A compiler combines constants together as a single multiplier where possible
Line 24
I(cont, gnd) <+ V(cont, gnd)/10k ;
Translates to:
is_ub__cont__gnd = 0.0001 * (tpl_mfactor * vp_ub__cont__gnd) ;
Line 24 is a branch contribution so the variable on the left is a source variable. These are composed in a similar manner to the probe variables described for line 25 above. Instead of the vp prefix, it uses the is prefix for 'Current source'. Note that probes on the right hand side of an equation or branch contribution do not use the same variable as sources on the left hand side.
The tpl_mfactor variable is the value assigned by the 'M' parameter used as a scaling factor. This is almost always 1.0 and you can usually ignore it.
Line 35
@(cross(comp_upper, 0, 0.1n)) ;
Translates to:
event_flag = cross(vp_ub__thresh__cont, 0, 1e-10, 0.0, 1, 0) ;
Line 35 calls the event function cross. If the event function triggers, the return value assigned to event_flag will be non-zero. In this example the purpose of the event function is to force a time step and no action is taken when the event is triggered. If, however, there was conditional code to be executed at the event, there would be an if statement following the event function.
Examining Variables
The debugger allows you to see in real-time the values assigned to any variable in the 'C' code. In most cases you can just move the mouse cursor over the variable and its value will be displayed. You can also add them to a "watch list" for a more permanent display.
Note that not all variables in the Verilog-A code will be represented using meaningful names in the 'C' code. If the result of building the full name leads to a name which is too long, a generic name in the form v_nnn (nnn is a integer) will be used instead.
Partial Derivatives
In many cases, the Verilog-A compiler will not only generate code to evaluate the expression in the Verilog-A file, but it will also generate code to evaluate the partial derivatives of that expression with respect to each of its dependent variables. This is shown in the following code:
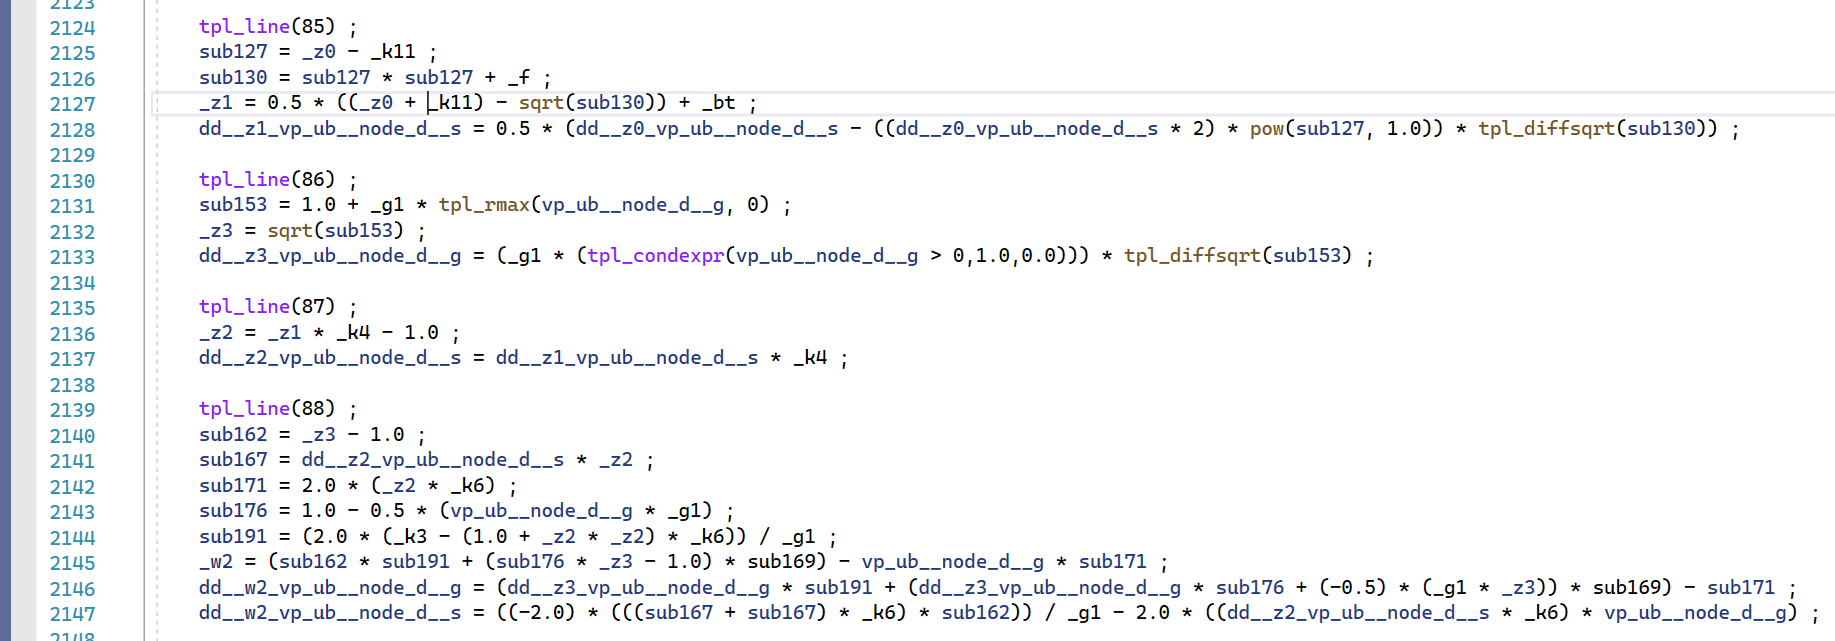
Line 88 for example compiles to 8 lines of 'C'. The first five lines are subexpressions, that is intermediate variables used to evaluate the final result. The final results are the variables _w2 representing the Verilog-A variable w2 along with dd__w2_vp_ub__node_d__g and dd__w2_vp_ub__node_d__s. dd__w2_vp_ub__node_d__g and dd__w2_vp_ub__node_d__s are partial derivatives of w2 with respect to V(node_d,g) and V(node_d,s) respectively. The partial derivatives form part of the iterative equation used to solve the non-linear system.
In most debugging sessions it isn't necessary to track the values of partial derivatives and you can focus on the main equation (w2 in the above example). However, there are cases where the main equation evaluates successfully but the partial derivatives suffers some numerical issue such as an overflow or divide-by-zero. Such events sometimes lead to a convergence failure but note that this is not always the case. The action of the simulator when an overflow occurs is to reject the time step and try again with a smaller time step. This strategy works more often than it doesn't so a failure to evaluate an equation or its partial derivative does not necessarily require attention.
Pre-evaluated Variables
You may notice that some of your Verilog-A code does not appear in the lf_load function. The usual reason for this is that the variables were pre-calculated prior to the start of the main simulation run. This happens for variables that are not dependent on any input and assume a constant value throughout the simulation. It is wasteful to re-evaluate such variables for every iteration so these are calculated once at the start.
You will find such variables in either the lf_temp or the lf_modtemp function. (The name 'temp' here means 'temperature' not 'temporary'. Its use is historic and originates from the original SPICE program where temperature dependent variables were pre-calculated separately to the dynamic variables).
Note that the Verilog-A compiler designates variables that are to be pre-evaluated using a cautious algorithm that may sometimes place the evaluation in lf_load unnecessarily.
Optimised Variables
There may be some variables that do not appear to be assigned at all. This will be because they have been optimised and typically this happens when a variable has a simple definition, is only used once or is not used at all. The value that was assigned to the variable would have been substituted directly where it was used.
Multi-thread Execution
If you have more than one instance of the Verilog-A design in your circuit, the code will be called for each instance. If multi-threading is enabled (which it is by default if the circuit is non-trivial), the execution of the code for the multiple instances will not be sequential. This makes debugging confusing. If this is the case, it is recommended that you disable multi-threading by adding this line to the F11 window:
.option mpnumthreads=1
Extended and Quad Precision
The Microsoft compiler does not support extended precision, that is the 80bit floating point values used by .options conv=3 and .options conv=4. In 'C' this is usually the data type long double but the Microsoft compiler treats long double as double, i.e. standard 64 bit floating point.
For this reason, Verilog-A modules compiled with the Microsoft compiler will not support extended precision modes and the device code will simply be evaluated to double precision. In most cases this will degrade the precision of the whole circuit not just the Verilog-A modules. For debugging purposes this will not likely present a problem, but you should remember to switch back to default release mode and recompile after debugging is complete.
The same applies to Quad precision although the reason is a little different. We haven't made the appropriate developments to enable quad precision using the Microsoft compiler; this is not a fundamental limitation of the compiler.
| ◄ Recompiling after Debugging | Trademarks ▶ |