Running Curve Fitting Example (SIMetrix)
Open the associated schematic by clicking on the Open button in the top right. It isn't essential for the schematic to be open when running the optimiser but if is open, the optimiser will use the state of the schematic as displayed even if it hasn't been saved. The schematic is shown below:
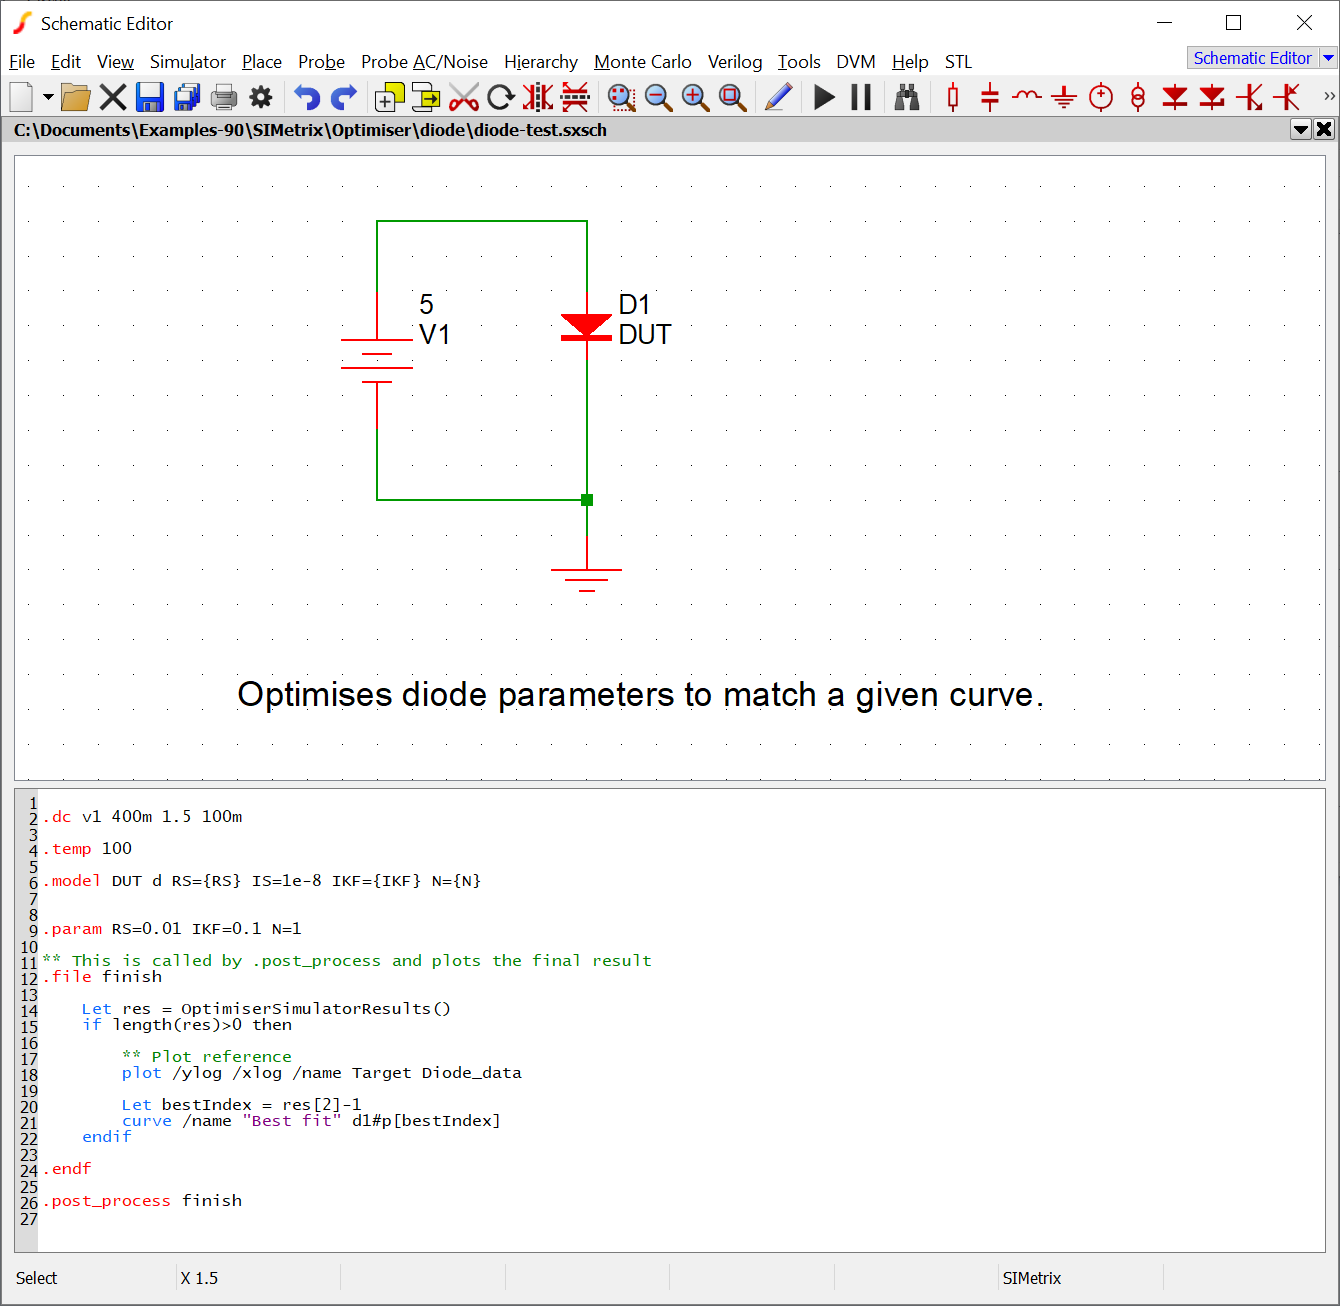
The optimiser's task is to find diode parameters that match the I-V curve defined by the data. The optimiser parameters are RS, IKF and N and these are assigned to the diode's model parameters of the same name.
To define the curve fit, the measurement uses the script function CurveFitLog(). CurveFitLog is one of four functions that may be used for curve fitting. All four functions compare two vectors and return a normalised value which indicates how closely they match. A value of zero means a perfect match.
The schematic includes some post-processing defined in the F11 window. This post-processing plots the final result along with the target data. This uses the script function OptimiserSimulatorResults() function which is one of many optimiser supporting functions. Refer to the Script Reference Manual/Applications/Optimiser for details of the Optimiser Script Functions.
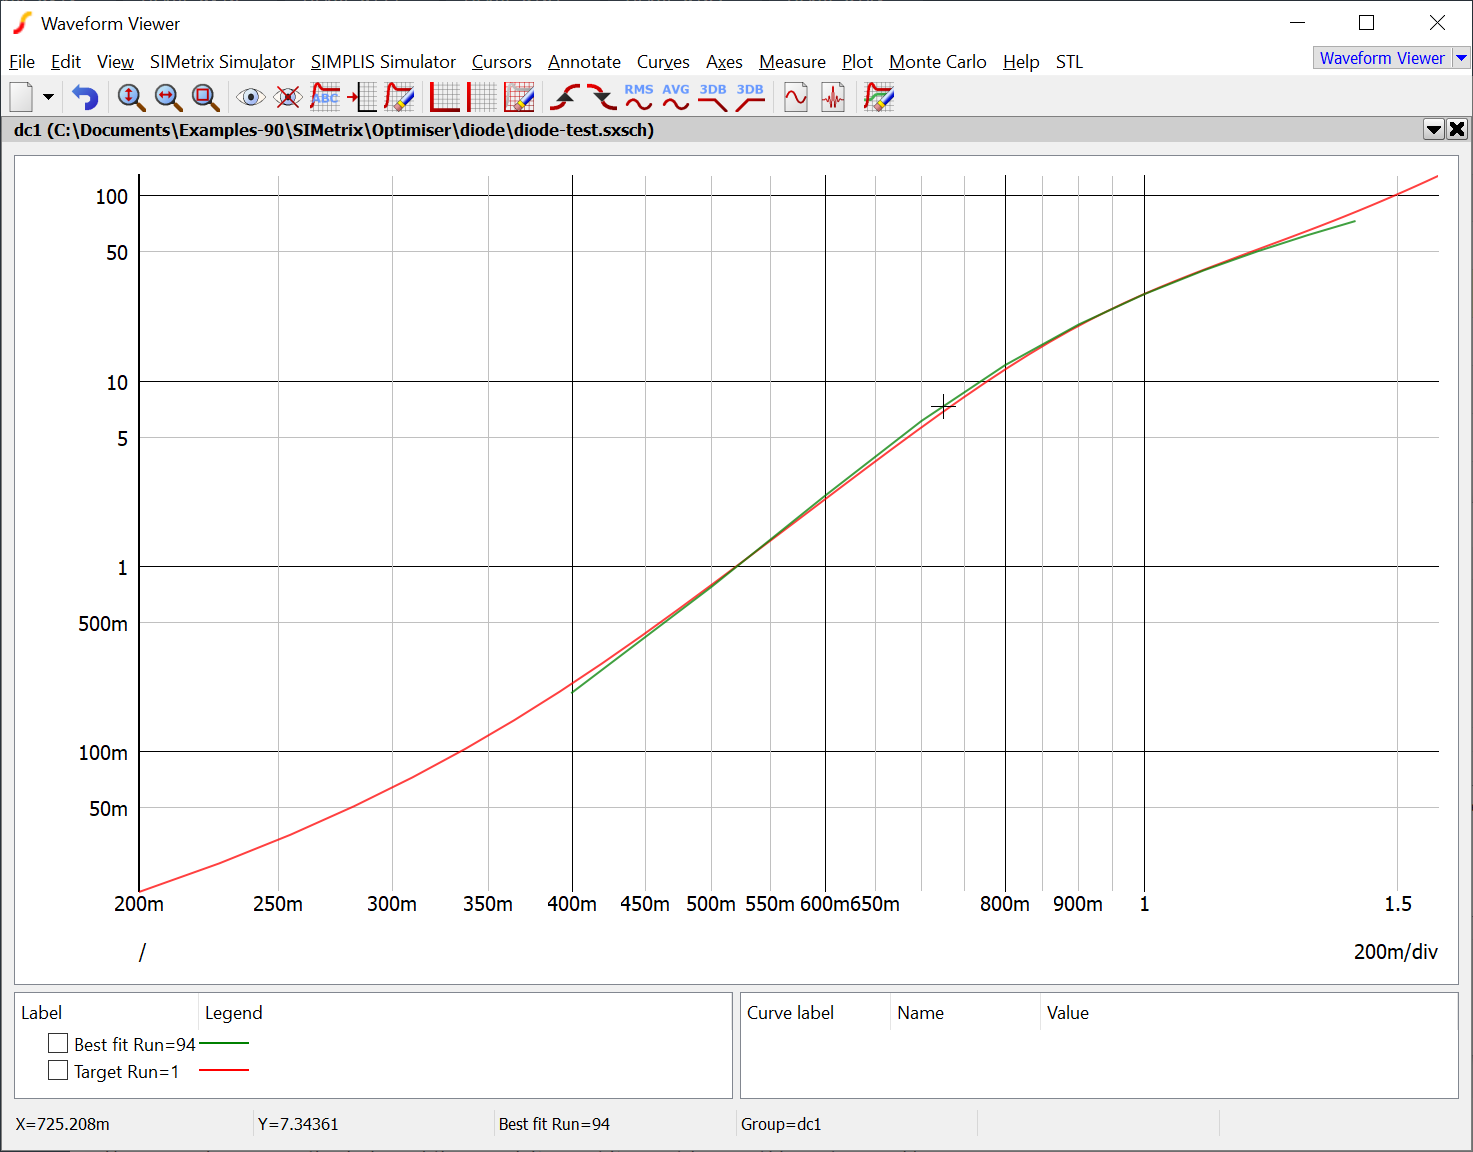
To run the optimiser, highlight the optimiser GUI then click on the Play button: 
You should see a graph show as shown below:
| ◄ Curve Fitting Example (SIMetrix) | Optimiser GUI Description ▶ |